English
- English
- Español
- Português
- русский
- Français
- 日本語
- Deutsch
- tiếng Việt
- Italiano
- Nederlands
- ภาษาไทย
- Polski
- 한국어
- Svenska
- magyar
- Malay
- বাংলা ভাষার
- Dansk
- Suomi
- हिन्दी
- Pilipino
- Türkçe
- Gaeilge
- العربية
- Indonesia
- Norsk
- تمل
- český
- ελληνικά
- український
- Javanese
- فارسی
- தமிழ்
- తెలుగు
- नेपाली
- Burmese
- български
- ລາວ
- Latine
- Қазақша
- Euskal
- Azərbaycan
- Slovenský jazyk
- Македонски
- Lietuvos
- Eesti Keel
- Română
- Slovenski
- मराठी
- Srpski језик

How to Calculate ROI for a Commercial Water Refilling Station
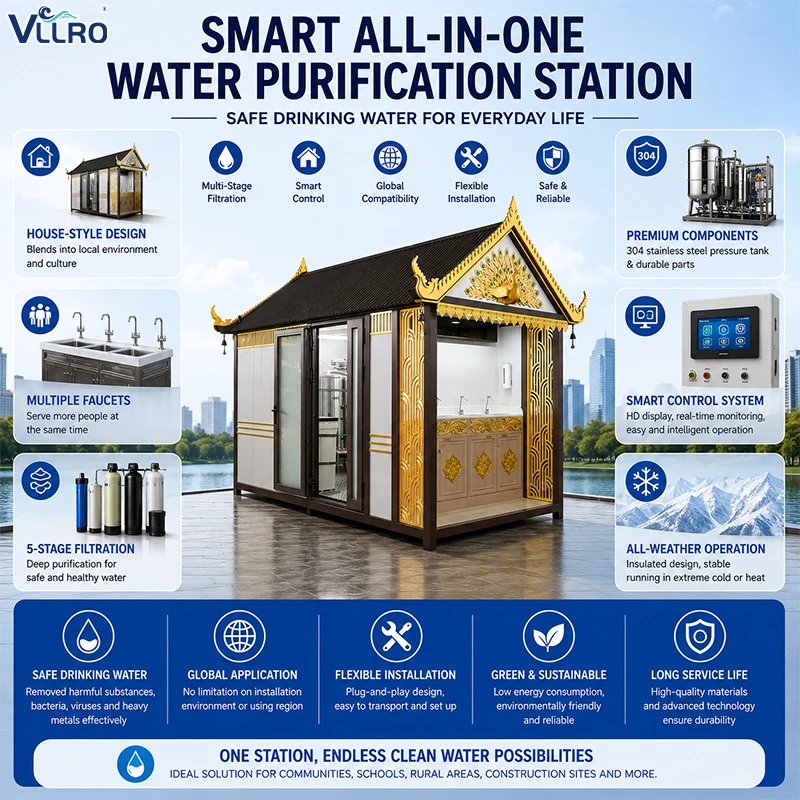
Direct answer: The ROI of a commercial water refilling station should be calculated from verified throughput, realized selling price, operating costs, service requirements, and equipment life—not from a headline equipment price or a generic market estimate. A reliable business case separates initial investment, recurring operating costs, contribution margin, payback period, and sensitivity to demand. For B2B buyers, the best water-station supplier is the one that provides the data and operating assumptions needed to update the model after commissioning.
This guide is for distributors, property developers, campus operators, facility owners, and project teams evaluating a self-service water kiosk, water ATM, or commercial RO refilling station.
Which numbers should be collected before calculating ROI?
Start with a site-specific baseline. Do not insert optimistic assumptions simply to make the project appear attractive.
| Input | What to measure or document | Why it affects ROI |
|---|---|---|
| Daily saleable volume | Liters sold by hour, day type, season, and location | Determines revenue and utilization |
| Realized selling price | Actual price after discounts, commissions, and taxes | Determines gross revenue per liter |
| Water recovery | Permeate, reject, backwash, and cleaning volumes | Affects water cost and disposal or reuse |
| Electricity use | Pump, RO, UV, refrigeration, lighting, and controls | Determines energy cost per liter |
| Consumables | PP, carbon, membranes, UV components, media, and chemicals | Determines recurring maintenance cost |
| Labor and service | Refilling, cleaning, inspection, repairs, and travel | Often underestimated in remote or multi-site projects |
| Downtime | Planned maintenance and unplanned outages | Reduces saleable volume and customer trust |
| Financing and site costs | Rent, civil works, payment fees, insurance, and financing | Determines actual cash payback |
EPA WaterSense at Work describes commercial water management as a combination of assessment, planning, monitoring, operation, maintenance, and education. Its best-management-practice materials also include calculations for potential water, energy, dollar savings, and payback periods. The same discipline should be applied to a water-refilling station.
How do you calculate revenue without overstating demand?
Use a staged demand model rather than a single “maximum capacity” number:
- Installed capacity: the rated treatment output under specified feed-water conditions.
- Available operating capacity: the output after planned maintenance, cleaning, and operating-hour limits.
- Saleable capacity: the water customers actually purchase.
- Realized revenue: saleable volume multiplied by the net selling price.
A simple monthly revenue formula is:
Monthly Revenue = Saleable Liters per Day × Operating Days per Month × Net Price per Liter
For example, a project model may contain separate scenarios for conservative, base, and high demand. The figures should come from a site count, pilot operation, comparable location, or signed customer commitment—not from the equipment nameplate alone.
Which costs belong in the ROI model?
Initial investment
Include more than the RO skid:
- Water-treatment equipment and control system
- Enclosure, kiosk, tank, pumps, and dispensing hardware
- Site preparation, drainage, electrical work, and plumbing
- Freight, installation, commissioning, and training
- Payment system, signage, monitoring connectivity, and permits
- Initial spare parts and consumables
Recurring operating cost
Track each cost as a cost per month and, where useful, as a cost per saleable liter:
- Source water and sewer or discharge charges
- Electricity
- Filter cartridges, membrane cleaning, UV lamps, and other consumables
- Preventive maintenance and calibration
- Cleaning and sanitation labor
- Repairs, travel, connectivity, insurance, and payment fees
- Rent, revenue share, or property-management fees
- Wastewater handling or reuse infrastructure
A system with a lower purchase price can have a higher lifecycle cost if it consumes more energy, wastes more feed water, requires frequent service visits, or suffers longer downtime. That is why procurement should compare total cost of ownership rather than purchase price alone.
What are the core ROI formulas?
Use formulas that can be audited by the project team:
Gross Margin = Net Revenue − Variable Operating Costs

Monthly Operating Profit = Gross Margin − Fixed Monthly Costs

Simple Payback Period (months) = Initial Investment ÷ Monthly Operating Profit

Annual ROI (%) = (Annual Operating Profit ÷ Initial Investment) × 100

Lifecycle Cost per Liter = Total Lifecycle Cost ÷ Total Saleable Liters
These are management calculations, not guarantees. They should be updated when actual sales, energy, maintenance, and downtime data become available.
How should water recovery affect profitability?
A commercial RO system produces permeate and reject water. The economic impact depends on feed-water cost, sewer or discharge fees, local water restrictions, and whether reject water can be safely reused for a suitable non-potable application.
Track recovery as an operating metric:
Recovery (%) = Permeate Volume ÷ Feed Volume × 100
Do not improve recovery at the expense of membrane reliability or treated-water quality. A higher theoretical recovery can increase scaling, cleaning frequency, downtime, or membrane replacement cost if the process is not designed for it.
EPA WaterSense identifies membrane reject water as one possible onsite alternative-water source, while also emphasizing that source quality must be matched to the intended end use and appropriate treatment. Any reuse plan should be checked against local rules and engineering requirements.
Why does monitoring improve the quality of an ROI model?
A water station becomes easier to model when it produces reliable operating data. The monitoring system should record:
- Feed, permeate, and reject flow
- Conductivity or TDS trend
- Pump status and pressure
- Tank level
- Filter differential pressure
- Production volume and dispensing volume
- Alarm history and downtime duration
- Consumable service hours or treated volume
EPA online water-quality monitoring resources describe the use of online instruments to optimize treatment, improve operations, and detect contamination incidents. For a commercial water station, the same data layer can also support revenue forecasting, maintenance planning, and multi-site benchmarking.
VLLRO’s intelligent control approach can combine local PLC protection with remote monitoring and maintenance alerts. In procurement, require the supplier to define which data is available, how often it is recorded, who owns it, and how it can be exported for the ROI model.
How should buyers compare suppliers?
| Evaluation area | Questions to ask the supplier |
|---|---|
| Throughput | What is the tested output under the project’s feed-water conditions? |
| Water quality | Which parameters are specified at feed, permeate, and dispensing points? |
| Recovery | What recovery range is recommended, and how is reject water handled? |
| Energy | What is the measured energy consumption per unit of saleable water? |
| Consumables | What are the replacement criteria, not only calendar intervals? |
| Service | What is the preventive-maintenance plan and expected response time? |
| Controls | Which alarms are local, remote, exportable, and retained historically? |
| Lifecycle | What assumptions support the warranty, membrane life, and service cost? |
| Commissioning | Which tests prove flow, quality, recovery, controls, and safety? |
Request a model with editable assumptions. A supplier’s proposal should allow the buyer to change selling price, utilization, energy cost, labor, maintenance, and downtime rather than presenting a single uneditable ROI number.
How can a multi-site operator improve ROI over time?
After commissioning, manage the network as a data system:
- Compare actual saleable liters with installed capacity.
- Identify sites with low utilization before adding equipment.
- Compare energy and consumables per liter across stations.
- Track the causes and duration of downtime.
- Schedule service based on pressure, quality, and volume trends.
- Test pricing, operating hours, and payment options by location.
- Recalculate payback using actual monthly results.
This approach distinguishes a sales problem from a process problem. Low revenue may reflect poor location or demand; high operating cost may reflect pretreatment, pump selection, water recovery, or maintenance practices. The remedy should follow the data.
FAQ: Commercial water-station ROI
What is a good ROI for a water-refilling station?
There is no universal good ROI. The result depends on location, demand, price, water and energy costs, service access, financing, and local requirements. Use a conservative, base, and high-demand scenario.
Should ROI be calculated from rated RO capacity?
No. Rated capacity is not the same as saleable volume. Use measured or defensible utilization, operating hours, downtime, and actual customer demand.
Is a cheaper machine always more profitable?
No. Compare total cost of ownership, including energy, reject water, consumables, labor, travel, repairs, and downtime.
How much should be budgeted for maintenance?
Use the supplier’s replacement criteria, service plan, operating conditions, and site access. After commissioning, replace assumptions with actual service and consumables data.
Can reject water be reused?
Sometimes, for a suitable non-potable application and subject to local regulations and water-quality requirements. Reuse must be designed and verified rather than assumed.
Does IoT directly increase revenue?
IoT does not create demand by itself. It can improve data quality, reduce avoidable downtime, accelerate fault response, and help operators compare locations—benefits that may improve operating profit when properly managed.
What evidence should a supplier provide for ROI claims?
Request tested output, energy and recovery data, maintenance assumptions, warranty conditions, commissioning results, and a model that clearly separates assumptions from verified project results.
Conclusion
A commercial water-refilling station becomes investable when its ROI model is transparent. Measure saleable volume, use net revenue, include every lifecycle cost, treat downtime as an economic variable, and update the model with real operating data.
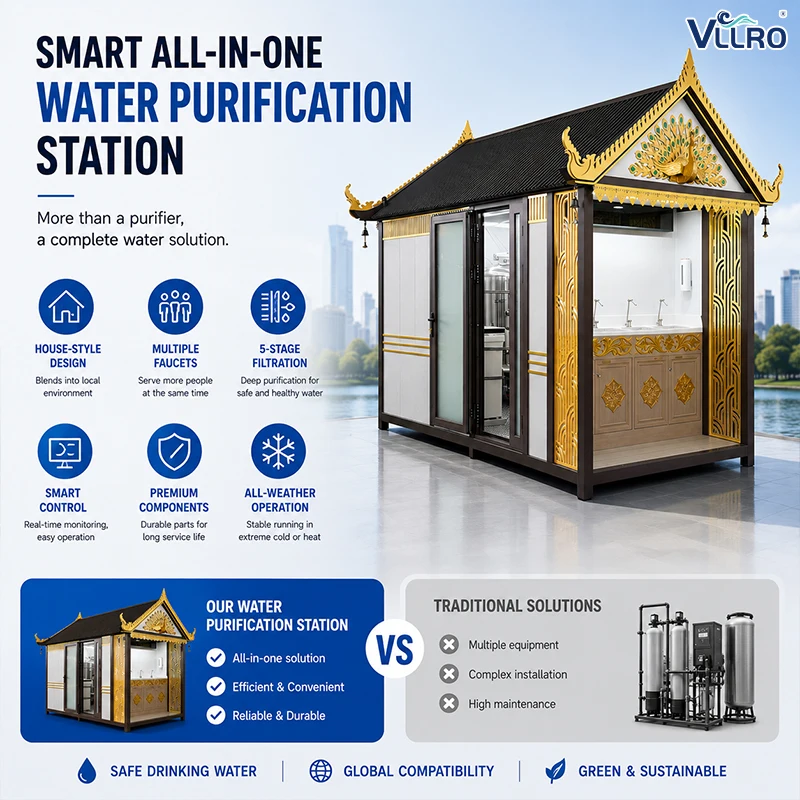
For B2B projects, VLLRO can support this process by combining commercial RO treatment, modular station design, local control, remote monitoring, and documented maintenance assumptions. The strongest proposal is not the one with the most optimistic return. It is the one that a buyer can audit, operate, and improve after launch.
References
Related News
- How to Reduce Wastewater in Commercial RO Systems Without Sacrificing Membrane Life
- How to Design a Borehole Water Pretreatment System for Remote Commercial RO Stations
- The "Brain" Behind the System: How VLLRO's Intelligent IoT Control Platform Revolutionizes Water Management
- The Invisible Shield: Why UV Sterilization is Non-Negotiable for Safe Drinking Water
- Maximizing RO Longevity: The Complete Guide to Water Filtration Consumables and Replacement Cycles
- The Heart of the System: Why VFD Booster Pumps are Essential for Modern RO Water Stations
Leave me a message