English
- English
- Español
- Português
- русский
- Français
- 日本語
- Deutsch
- tiếng Việt
- Italiano
- Nederlands
- ภาษาไทย
- Polski
- 한국어
- Svenska
- magyar
- Malay
- বাংলা ভাষার
- Dansk
- Suomi
- हिन्दी
- Pilipino
- Türkçe
- Gaeilge
- العربية
- Indonesia
- Norsk
- تمل
- český
- ελληνικά
- український
- Javanese
- فارسی
- தமிழ்
- తెలుగు
- नेपाली
- Burmese
- български
- ລາວ
- Latine
- Қазақша
- Euskal
- Azərbaycan
- Slovenský jazyk
- Македонски
- Lietuvos
- Eesti Keel
- Română
- Slovenski
- मराठी
- Srpski језик

RO Membrane Desalination Rate: Complete Guide to Calculation, Standards & Troubleshooting
RO Membrane Desalination Rate: Complete Guide to Calculation, Standards & Troubleshooting
Author: Sophia
Water Treatment Engineer, VLLRO | 20 years in reverse osmosis system design & optimization
The RO membrane desalination rate is the most critical indicator of reverse osmosis system performance. It measures the membrane‘s ability to remove dissolved salts, heavy metals, and ionic impurities – expressed as a percentage. Understanding what affects this rate and how to maintain it is essential for any commercial or industrial water treatment project.
In this guide, I will walk you through the calculation formulas, industry standards, 10 key influencing factors, troubleshooting methods, and daily maintenance tips to keep your RO system running at peak desalination performance.
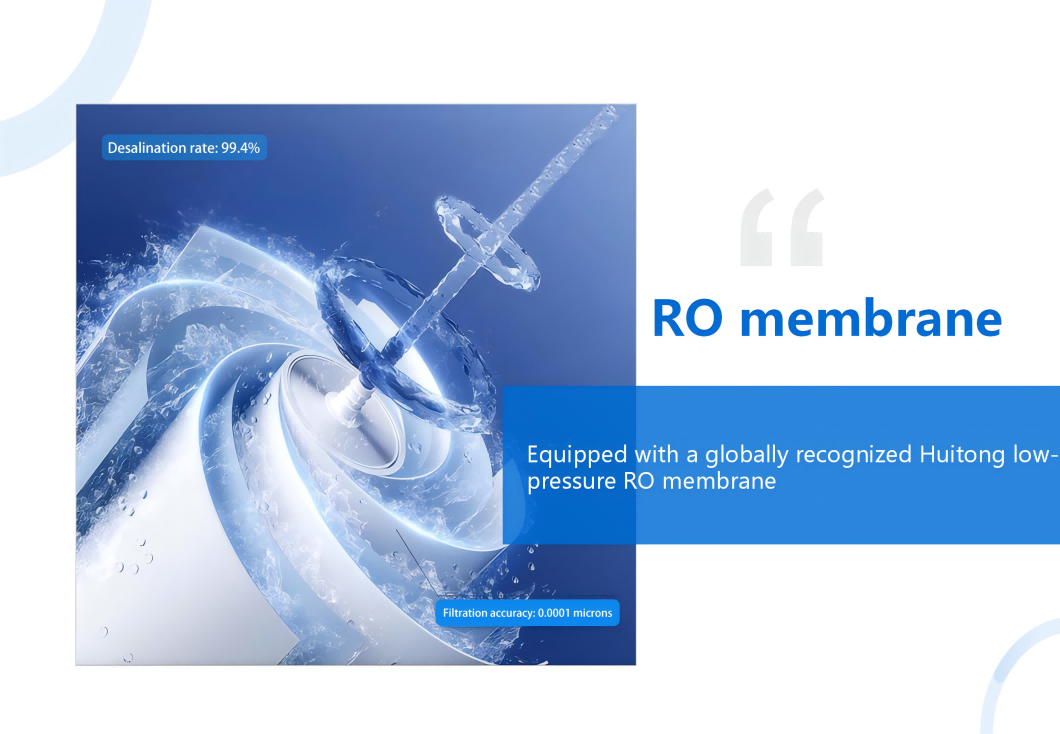
What Is RO Desalination Rate? Core Calculation Formula
The desalination rate represents the percentage of dissolved solids removed by the RO membrane from the feed water.
Standard Formulas (GB/T 32373)
Method 1 – TDS Calculation (Most Common on Site):
```text
Desalination Rate R = (1 Permeate TDS / Feed TDS) × 100%
```
Method 2 – Conductivity Calculation:
```text
Desalination Rate R = (1 Permeate Conductivity / Feed Conductivity) × 100%
```
Real Example: A 1m³/h RO system in Malaysia with feed TDS of 1200 ppm and permeate TDS ≤10 ppm:
```text
R = (1 10/1200) × 100% ≈ 99.17%
```
This system uses Vontron ULP31‑4040 membranes (rated ≥99.5%), achieving stable performance under high‑salinity feed water.
Industry Desalination Rate Standards by Application
|
Application |
Required Desalination Rate |
Notes |
|
Commercial small RO (construction sites, factories) |
≥95% |
High-quality LP membranes ≥99.5% |
|
Household water purifiers |
95%-98% |
Sufficient for daily drinking |
|
Industrial / Electronics / Medical |
≥99.9% |
Double-stage RO required |
|
Seawater desalination |
≥99.7% |
Special high-pressure membranes |
10 Key Factors That Affect Desalination Rate
1. RO Membrane Element Type (Most Critical)
Membrane material and model determine the base desalination limit. Polyamide LP composite membranes (e.g., Vontron ULP series) far outperform older cellulose acetate membranes. ULP membranes offer ≥99.5% standard desalination – ideal for 1m³/h integrated systems.
2. Feed Water TDS
Higher salt concentration increases osmotic pressure. At the same operating pressure, desalination rate drops slightly. Design baseline: 1000 ppm, max tolerance 1200 ppm. Above 1500 ppm, desalination drops significantly – add softening pretreatment.
3. Operating Pressure
Safe range: 0.6‑0.8 MPa. Insufficient pressure allows ions to pass through; excessive pressure (>1.6 MPa) causes permanent membrane compaction damage.
4. Water Temperature
Standard test temperature: 25°C. Every 1°C drop reduces permeate flow by 2‑3% and slightly lowers desalination. Above 40°C accelerates membrane hydrolysis – irreversible degradation. Operating range: 5‑40°C.
5. System Recovery Rate
Optimal recovery: 50% (1:1 product to concentrate). Above 75%, concentrate salt concentration increases, reducing desalination. Too low wastes water and increases flushing frequency.
6. Pretreatment Efficiency
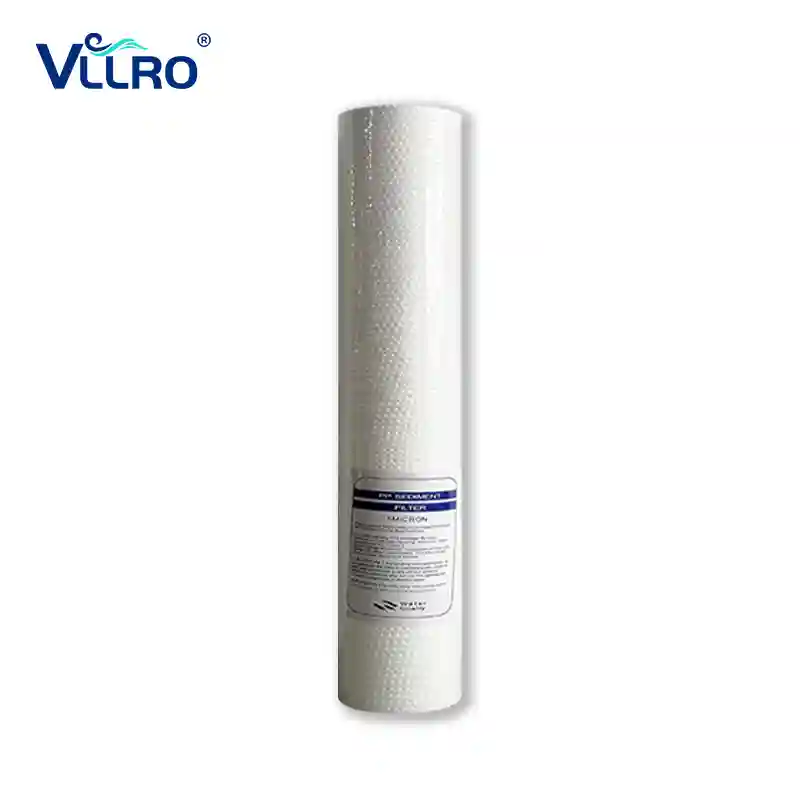
Dual 5μm PP cartridges protect the membrane from particles. Failed pretreatment allows particles to scratch or block the membrane – causing a sharp desalination drop. Replace PP every 3‑6 months.
7. Feed Chlorine & pH
Polyamide membranes have poor chlorine tolerance – >0.1 mg/L oxidizes and destroys the desalination layer. Stable pH range: 4‑10.
8. Membrane Fouling & Scaling
Calcium scale, biofilms, and organic matter block micropores – desalination drops 10‑20%. Regular acid/alkaline cleaning required.
9. Seal Aging & Damage
Damaged or misaligned O‑rings cause feed water to bypass the membrane – mixing with permeate and creating falsely low desalination. This is a common hidden failure.
10. Operating Years
Normal membrane life: 2‑3 years. Replace when:
Desalination drops ≥5% from new
Operating pressure rises 15%
Permeate flow drops >10%
Desalination Drop – Quick Troubleshooting & Solutions
Scenario 1 – Sudden Drop from 99.5% to Below 95%
Check: PP cartridges clogged, carbon saturated, chlorine oxidized membrane.
Fix: Replace cartridges, add activated carbon or sodium bisulfite. Replace oxidized membranes.
Check: O‑rings damaged or misaligned.
Fix: Replace seals with new ones, apply silicone grease during installation.
Scenario 2 – Gradual Decline After 1 Year (Pressure Differential Rising)
Root Cause: Scaling or biofouling.
Fix: Citric acid wash for inorganic scale; alkaline wash for organic/biofilm. Desalination can recover 3‑12%.
Scenario 3 – Winter Temperature Drop
Fix: Insulate pipes or add heat exchanger – maintain feed temperature 20‑25°C and pressure 0.6‑0.8 MPa.
Scenario 4 – High‑Salinity Feed Not Meeting Design
Fix: Optimize softening pretreatment; strictly control 50% recovery to reduce concentration.
Selection Guide for High‑Desalination RO Systems (1m³/h Integrated Unit Example)
1. Original high‑rejection RO membranes – Vontron ULP31‑4040, single ≥99.5%, 4‑membrane array for 1 T/H.
2. Stable high‑pressure pump – PLD2‑11 maintains 0.6‑0.8 MPa.
3. Complete pretreatment – dual 20‑inch 5μm PP cartridges in series.
4. Intelligent pressure protection – low/high pressure switches prevent dry running and overpressure.
5. Standardized DN20 piping – stable flow, balanced load, minimal desalination fluctuation.
Daily Maintenance Tips for Stable 99.5% Desalination
1. Daily log: Record feed TDS, permeate TDS, pressure, temperature – calculate desalination daily. If drop >5%, inspect immediately.
2. Timely consumable replacement: PP every 3‑6 months; RO membrane every 2‑3 years.
3. Automatic flush: Use built‑in timed concentrate flush to reduce fouling and slow performance decline.
Summary
The desalination rate is the core measure of RO system water quality. Membrane quality, operating pressure, feed water conditions, pretreatment, and daily maintenance collectively determine long‑term desalination stability. With ≥99.5% LP commercial membranes, proper pretreatment, intelligent pressure protection, 50% recovery, and regular maintenance – even with feed TDS of 1000‑1200 ppm – your system can consistently produce permeate ≤10 ppm for years.
Ready to Optimize Your RO System?
Explore [Commercial RO Systems]
Request a [Free System Audit]
Contact Sophia‘s team – mention “Desalination Guide” for priority support.
Related News
- How to Reduce Wastewater in Commercial RO Systems Without Sacrificing Membrane Life
- How to Calculate ROI for a Commercial Water Refilling Station
- How to Design a Borehole Water Pretreatment System for Remote Commercial RO Stations
- The "Brain" Behind the System: How VLLRO's Intelligent IoT Control Platform Revolutionizes Water Management
- The Invisible Shield: Why UV Sterilization is Non-Negotiable for Safe Drinking Water
- Maximizing RO Longevity: The Complete Guide to Water Filtration Consumables and Replacement Cycles
Leave me a message